Jeremy A. Cook
Department of Business and Economics - Wheaton College
Timothy W. Taylor
Department of Politics and International Relations - Wheaton College
Throughout the past two decades, academics and policymakers have warned, with increasing vigor, Americans are coming apart as social capital is weakening across American communities. While several characteristics such as volunteerism, participation in the labor force, marriage rates, and even charitable giving are waning, not all communities are experiencing the deterioration. Indeed, several researchers have created measurements of social capital to assess the health of counties and states. Considering the importance of philanthropy as both a measurement of community health and a necessary input for nonprofit organizations, existing research has yet to focus upon the link between location and charitable giving. Working with FPE Scholars, Collin Bastian and Noa Nakao, we investigated the degree to which location drives philanthropy across all counties in the United States.
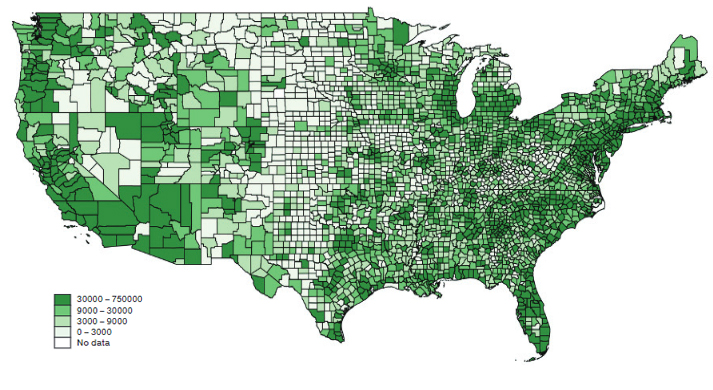
Figure 1: Individual charitable contributions for each county in the U.S.
Using itemized tax return data from the Internal Revenue Service (IRS), we first constructed a series of descriptive maps to assess philanthropy in United States counties. Figure 1 reports aggregate individual charitable contributions for each county, where expectedly, we find total giving tends to be higher in wealthier counties. Figure 2 depicts giving as a proportion of adjusted gross income (AGI), a measurement of generosity that represents the percent of income given to charitable organizations.
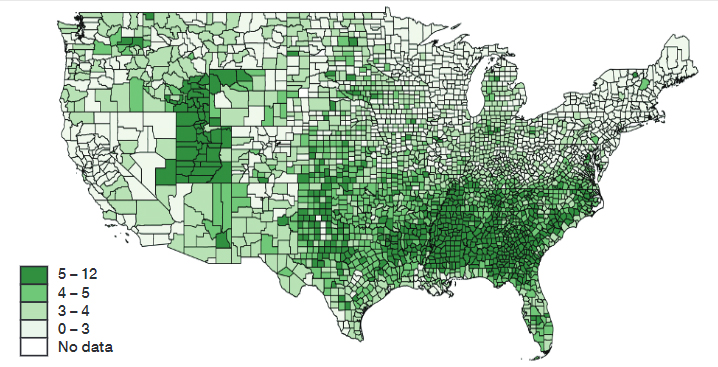
Figure 2: Giving as Percentage of AGI
When focusing on generosity, as opposed to the sum of contributions, we find a more surprising pattern; namely, generosity tends to be lower in coastal and cosmopolitan counties. However, generosity is not necessarily associated with an urban-rural divide. Instead, we find that as the religious devotion of a county increases, the county has a larger percentage of income given to nonprofit organizations.
The main contribution of our work was to build a statistical model using multiple variables that predict charitable giving in a county. We use existing research findings from the philanthropy literature to motivate our variable selection for the statistical models. Specifically, we assess county demographics such as income, unemployment rates, education, age, marriage rates, partisanship, and other characteristics. Important for this study, we include measurements of religious identity and levels of religious devotion.
Our statistical model allows us to measure the extent to which each characteristic positively or negatively predicts generosity. For example, generosity increases as the religious devotion in a county increases, however, increasing unemployment rates negatively affects generosity. These statistical results are used to find each county’s predicted level of generosity. We then calculate the difference between predicted generosity and the actual giving as a proportion of AGI for each county. This final calculation is used to create a performance map as shown in Figure 3. The performance map depicts the difference in observed generosity and the generosity one would expect from the county given its specific characteristics.
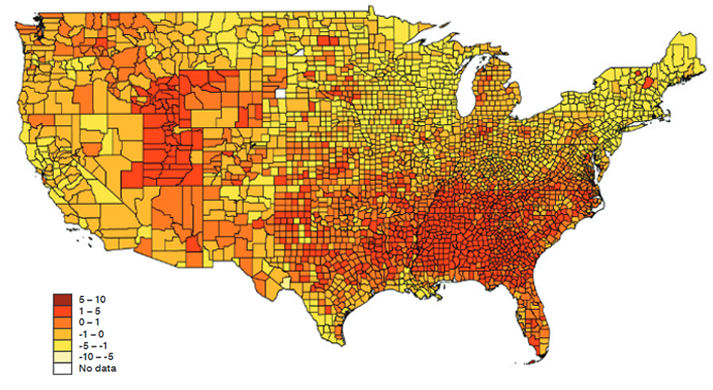
Figure 3: Giving per AGI: Actual minus Expected
The color of the county represents whether the county is more or less generous than what the statistical model predicts. Counties marked by deep red are more generous while counties colored in light yellow are less generous than their predicted values. If demographics alone explain the generosity of a county, we should see little variation in the performance map. However, we find rich difference in actual giving compared to predicted giving. This suggests that some aspect of individuals’ philanthropy is connected to their location and the community in which they live.
We further identify specific counties in each state that are notable for their performance against expectations. Specifically, Table 1 lists the top over-performing and under-performing counties for each state.
This research, supported by the Wheaton Center for Faith, Politics and Economics, is important to academic research and to those organizations dependent upon charitable contributions. Identifying total giving and generosity for American counties is a first step to determine why one location is more philanthropic than another. A second step is comparing actual generosity to a prediction from statistical modeling. However, there is work left undone in ascertaining the reason some communities are more (or less) generous than what even their demographics would predict.
Table 1: Top over-performing and under-performing counties for each state
| State | Top Over-Performing County | Top Under-Performing County |
|---|---|---|
| Alabama | Clay County | Baldwin County |
| Alaska | Southeast Fairbanks Census Area | Lake and Peninsula Borough |
| Arizona | Graham County | La Paz County |
| Arkansas | Benton County | Izard County |
| California | San Mateo County | Colusa County |
| Colorado | Conejos County | Cheyenne County |
| Connecticut | Fairfi eld County | Windham County |
| Delaware | Kent County | New Castle County |
| Florida | Gadsden County | Miami-Dade County |
| Georgia | Floyd County | Lanier County |
| Hawaii | Maui County | Hawaii County |
| Idaho | Madison County | Adams County |
| Illinois | Schuyler County | Calhoun County |
| Indiana | Wabash County | Perry County |
| Iowa | Sioux County | Monona County |
| Kansas | Kiowa County | Elk County |
| Kentucky | Carlisle County | Martin County |
| Louisiana | East Carroll Parish | Evangeline Parish |
| Maine | Hancock County | Somerset County |
| Maryland | Prince George's County | Cecil County |
| Massachusetts | Suffolk County | Hampden County |
| Michigan | Missaukee County | Iron County |
| Minnesota | Pipestone County | Mahnomen County |
| Mississippi | Noxubee County | Hancock County |
| Missouri | Taney County | Carroll County |
| Montana | Silver Bow County | Treasure County |
| Nebraska | Logan County | Blaine County |
| Nevada | Lincoln County | Humboldt County |
| New Hampshire | Grafton County | Stratford County |
| New Jersey | Cape May County | Stratford County |
| New Mexico | De Baca County | Hudson County |
| New York | Saratoga County | Union County |
| North Carolina | Chowan County | Clinton County |
| North Dakota | Barnes County | Currituck County |
| Ohio | Holmes County | Rolette County |
| Oklahoma | Major County | Putnam County |
| Oregon | Wallowa County | Sherman County |
| Pennsylvania | Lancaster County | Lackawanna County |
| Rhode Island | Bristol County | Kent County |
| South Carolina | Hampton County | Dorchester County |
| South Dakota | Hanson County | Carson County |
| Tennessee | Haywood County | Clay County |
| Texas | McMullen County | Terrell County |
| Utah | Rich County | Grand County |
| Vermont | Lamoille County | Essex County |
| Virginia | Martinsville City | Fairfax City |
| Washington | Whitman County | Lincoln County |
| West Virginia | Mercer County | Clay County |
| Wisconsin | Door County | Forest County |
| Wyoming | Teton County | Crook County |